INTRODUCTION
What is ' MNIST ' ? It's a dataset of handwritten, but also makes a lot of newbies frustrated.
https://en.wikipedia.org/wiki/MNIST_database
MNIST database - Wikipedia
From Wikipedia, the free encyclopedia Database of handwritten digits Sample images from MNIST test dataset The MNIST database (Modified National Institute of Standards and Technology database[1]) is a large database of handwritten digits that is commonly u
en.wikipedia.org
So, I'm gonna introduce how to learn ' MNIST ' data into model and figure wrong predictions out.
Also draw number with open-source package ' OpenCV ' and predict it !
Let's check the Result and Code below.
RESULT
CODE
import cv2
import numpy as np
import tensorflow as tf
import os
import matplotlib.pyplot as plt
import random
os.environ['TF_CPP_MIN_LOG_LEVEL'] = '3'

# Global Variables
mouse_mode = False
pt = (0, 0)
color = (200, 200, 200)
thickness = 9
image = np.full((280, 280, 3), 0, np.uint8)
Test = np.full((280, 280, 3), 0, np.uint8)
Predict_Window = np.full((280, 500, 3), 255, np.uint8)
prediction = None

# MNIST Data Set import
mnist = tf.keras.datasets.mnist
(train_data, train_label), (test_data, test_label) = mnist.load_data()

# Normalize
train_data, test_data = train_data/255.0, test_data/255.0

# Flatten
train_data = train_data.reshape(60000, 784).astype('float32')
test_data = test_data.reshape(10000, 784).astype('float32')


# Model
model = tf.keras.models.Sequential([
    tf.keras.layers.Dense(512, activation='relu'),
    tf.keras.layers.Dense(10, activation='softmax')
])

# Model Compile
model.compile(optimizer='adam',
              loss='sparse_categorical_crossentropy',
              metrics=['accuracy'])


model.fit(train_data, train_label, epochs=10)
train_result = model.evaluate(test_data, test_label)
print('loss :', train_result[0])
print('Acc  :', train_result[1])

predict_result = model.predict(test_data)
predict_label = np.argmax(predict_result, axis=1)


# Selection
wrong_result = []

for i in range(0, len(test_label)):
    if(predict_label[i] != test_label[i]):
        wrong_result.append(i)

print("Error : " + str(len(wrong_result)))

sample = random.choices(population=wrong_result, k=16)

# Plot
plt.figure(figsize=(14, 12))

for i, id in enumerate(sample):
    plt.subplot(4, 4, i+1)
    plt.imshow(test_data[id].reshape(28, 28), cmap='gray')
    plt.title("Label : " + str(test_label[id]) + " | Predict : " + str(predict_label[id]))
    plt.axis('off')

plt.show()

# Save
# plt.savefig("fig1.png", dpi=1500)

def onMouse(event, x, y, flags, param):
    global pt, mouse_mode, color, thickness, image, Test, prediction, Predict_Window

    if event == cv2.EVENT_LBUTTONDOWN:
        pt = (x, y)
        mouse_mode = True

    elif event == cv2.EVENT_MOUSEMOVE:
        if mouse_mode == True:
            cv2.line(image, pt, (x, y), color, thickness)
            pt = (x, y)

    elif event == cv2.EVENT_LBUTTONUP:
        mouse_mode = False
        cv2.line(image, pt, (x, y), color, thickness)

    elif event == cv2.EVENT_RBUTTONDOWN:
        Test = cv2.resize(image, (28, 28), interpolation=cv2.INTER_LINEAR)
        Test = cv2.cvtColor(Test, cv2.COLOR_BGR2GRAY)
        Test = Test / 255.0
        Test = Test.reshape(1, 784).astype('float32')
        predict_result = model.predict(Test)
        prediction = np.argmax(predict_result, axis=1)
        print(prediction)
        image = np.full((280, 280, 3), 0, np.uint8)
        Predict_Window = np.full((280, 500, 3), 255, np.uint8)
        cv2.putText(Predict_Window, 'Predict : ' + str(prediction[0]), (50, 100), cv2.FONT_HERSHEY_SIMPLEX, 2, (0, 0, 0), 2)
        cv2.imshow("Predict", Predict_Window)


cv2.imshow("PaintCV", image)
cv2.putText(Predict_Window, 'Predict : ', (50, 100), cv2.FONT_HERSHEY_SIMPLEX, 2, (0, 0, 0), 2)
cv2.imshow("Predict", Predict_Window)
cv2.setMouseCallback("PaintCV", onMouse)

while True:

    cv2.imshow("PaintCV", image)
    if cv2.waitKey(1) == 27:
        break

cv2.destroyAllWindows()

SOFTWARE SPECIFICATION
| OS | Ubuntu 18.04 LTS |
| Python | 3. 9. 16 |
| OpenCV | 3. 4. 11 |
| Tensorflow | 2. 7. 0 |
CODE EXPLAIN
Let's check the code sentence by sentence.
Import Tensorflow
import tensorflow as tf
os.environ['TF_CPP_MIN_LOG_LEVEL'] = '3'
os sentence for Tensorflow error.
Load Dataset
# MNIST Data Set import
mnist = tf.keras.datasets.mnist
(train_data, train_label), (test_data, test_label) = mnist.load_data()

# Normalize
train_data, test_data = train_data/255.0, test_data/255.0

# Flatten
train_data = train_data.reshape(60000, 784).astype('float32')
test_data = test_data.reshape(10000, 784).astype('float32')
First sentence of above code block loads mnist data from dataset of Keras in Tensorflow library, and divides it with train and test data.
And Second sentence is called ' Normalization ' and the reason why should we normalize data is.. check link below.
https://pipeline.zoominfo.com/operations/what-is-data-normalization
Data Normalization: 3 Reason to Normalize Data | ZoomInfo
Data normalization creates relativity and context within your database by grouping similar values into one common value. Here's why that's important.
pipeline.zoominfo.com
And next, flatting our data to match learning form.
Model
# Model
model = tf.keras.models.Sequential([
    tf.keras.layers.Dense(512, activation='relu'),
    tf.keras.layers.Dense(10, activation='softmax')
])
Our Model use ' Relu ' function, short of ' Rectified Linear Unit '.
It literally used to rectify Input.

Again, I'll left the concept of ' Relu ' function with link below.
https://en.wikipedia.org/wiki/Rectifier_(neural_networks)
Rectifier (neural networks) - Wikipedia
From Wikipedia, the free encyclopedia Activation function Plot of the ReLU rectifier (blue) and GELU (green) functions near x = 0 In the context of artificial neural networks, the rectifier or ReLU (rectified linear unit) activation function[1][2] is an ac
en.wikipedia.org
There's another well-known rectifier, ' Sigmoid '.

https://en.wikipedia.org/wiki/Sigmoid_function
Sigmoid function - Wikipedia
From Wikipedia, the free encyclopedia Mathematical function having a characteristic "S"-shaped curve or sigmoid curve A sigmoid function is a mathematical function having a characteristic "S"-shaped curve or sigmoid curve. A common example of a sigmoid fun
en.wikipedia.org
But recently, people prefer ' Relu ' than ' Sigmoid '.
And also, there's another function, ' Softmax '.

https://en.wikipedia.org/wiki/Softmax_function
Softmax function - Wikipedia
From Wikipedia, the free encyclopedia Smooth approximation of one-hot arg max This article is about the smooth approximation of one-hot arg max. For the smooth approximation of max, see LogSumExp. "Softmax" redirects here. For the Korean video game and ent
en.wikipedia.org
Please check why these functions are used.
Model Optimizer
# Model Compile
model.compile(optimizer='adam',
              loss='sparse_categorical_crossentropy',
              metrics=['accuracy'])
And next, it indicates how to compile model.
First, Optimizer ' Adam '. Optimizer is a concept of how to minimize lose function and there're ' SGD ', Stochastic Gradient Descent, ' Adam ' and ' AdaGrad ' and so on.
https://keras.io/api/optimizers/adam/
Keras documentation: Adam
Adam [source] Adam class tf.keras.optimizers.Adam( learning_rate=0.001, beta_1=0.9, beta_2=0.999, epsilon=1e-07, amsgrad=False, weight_decay=None, clipnorm=None, clipvalue=None, global_clipnorm=None, use_ema=False, ema_momentum=0.99, ema_overwrite_frequenc
keras.io
And next one is ' Cross-Entropy '.

In deep learning, Cross - Entropy 's p(x) is ' One - Hot - Encoding ', which means give 1 to desired set and 0 to undesired, so the output of undesired set should be 0.
https://en.wikipedia.org/wiki/Cross_entropy
Cross entropy - Wikipedia
From Wikipedia, the free encyclopedia Information theory measure In information theory, the cross-entropy between two probability distributions p {\displaystyle p} and q {\displaystyle q} over the same underlying set of events measures the average number o
en.wikipedia.org
Train Result
model.fit(train_data, train_label, epochs=10)
train_result = model.evaluate(test_data, test_label)
print('loss :', train_result[0])
print('Acc  :', train_result[1])
And ' Epoch ' means a number to iterate learning. Deep Learning has very complex process, so it advanced by iteration.
https://en.wikipedia.org/wiki/Epoch
Epoch - Wikipedia
From Wikipedia, the free encyclopedia Reference point from which time is measured In chronology and periodization, an epoch or reference epoch is an instant in time chosen as the origin of a particular calendar era. The "epoch" serves as a reference point
en.wikipedia.org
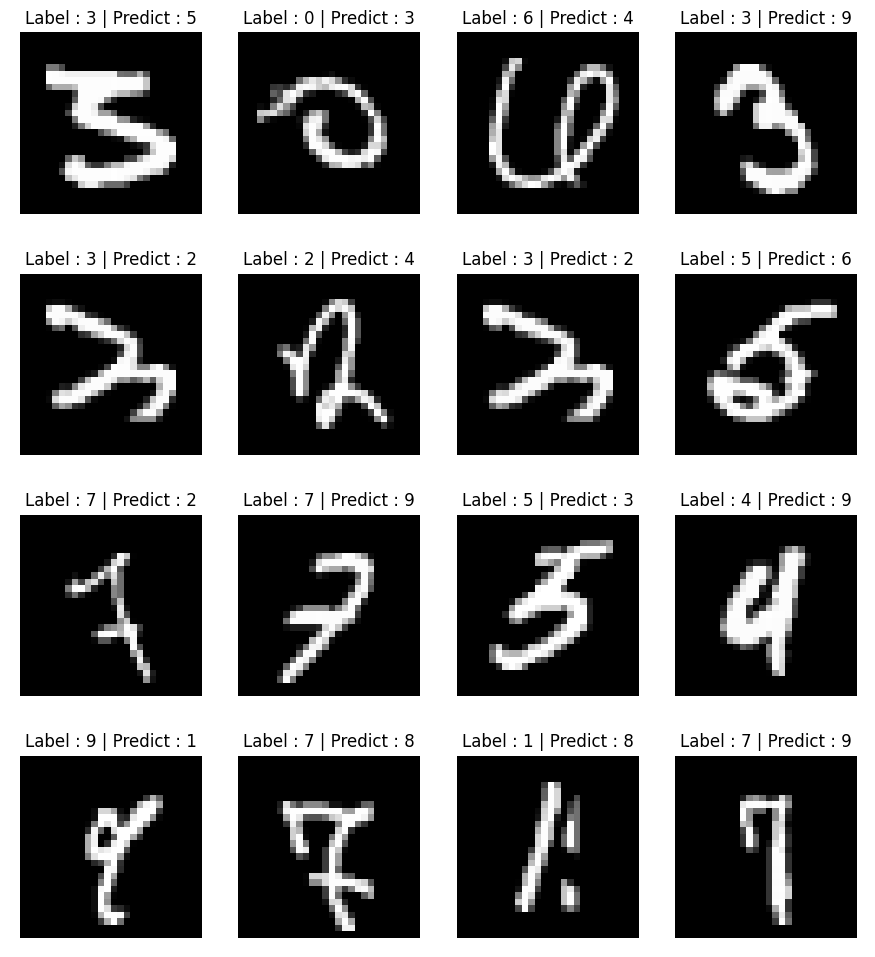
Plot Wrong Predictions
# Selection
wrong_result = []

for i in range(0, len(test_label)):
    if(predict_label[i] != test_label[i]):
        wrong_result.append(i)

print("Error : " + str(len(wrong_result)))

sample = random.choices(population=wrong_result, k=16)

# Plot
plt.figure(figsize=(14, 12))

for i, id in enumerate(sample):
    plt.subplot(4, 4, i+1)
    plt.imshow(test_data[id].reshape(28, 28), cmap='gray')
    plt.title("Label : " + str(test_label[id]) + " | Predict : " + str(predict_label[id]))
    plt.axis('off')

plt.show()

# Save
# plt.savefig("fig1.png", dpi=1500)
Next Code is just pick random samples with ' random ' library in python, and append wrong predicitions on wrong_result list. ' Matplotlib ' helps you to plot easily.
Callback to Draw
def onMouse(event, x, y, flags, param):
global pt, mouse_mode, color, thickness, image, Test, prediction, Predict_Window
if event == cv2.EVENT_LBUTTONDOWN:
pt = (x, y)
mouse_mode = True
elif event == cv2.EVENT_MOUSEMOVE:
if mouse_mode == True:
cv2.line(image, pt, (x, y), color, thickness)
pt = (x, y)
elif event == cv2.EVENT_LBUTTONUP:
mouse_mode = False
cv2.line(image, pt, (x, y), color, thickness)
elif event == cv2.EVENT_RBUTTONDOWN:
Test = cv2.resize(image, (28, 28), interpolation=cv2.INTER_LINEAR)
Test = cv2.cvtColor(Test, cv2.COLOR_BGR2GRAY)
Test = Test / 255.0
Test = Test.reshape(1, 784).astype('float32')
predict_result = model.predict(Test)
prediction = np.argmax(predict_result, axis=1)
print(prediction)
image = np.full((280, 280, 3), 0, np.uint8)
Predict_Window = np.full((280, 500, 3), 255, np.uint8)
cv2.putText(Predict_Window, 'Predict : ' + str(prediction[0]), (50, 100), cv2.FONT_HERSHEY_SIMPLEX, 2, (0, 0, 0), 2)
cv2.imshow("Predict", Predict_Window)
cv2.imshow("PaintCV", image)
cv2.putText(Predict_Window, 'Predict : ', (50, 100), cv2.FONT_HERSHEY_SIMPLEX, 2, (0, 0, 0), 2)
cv2.imshow("Predict", Predict_Window)
cv2.setMouseCallback("PaintCV", onMouse)
while True:
cv2.imshow("PaintCV", image)
if cv2.waitKey(1) == 27:
break
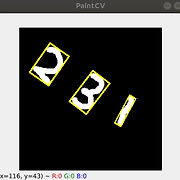
cv2.destroyAllWindows()Let's look our final code. onMouse ' callback ' function receives mouse event, and draw lines on paint image. If you pull right button on mouse, the Code hand over our drawn image to the model, and the model predicts number.
' While ' sentence keeps updating our paint image and show.
Since out paint image is not fit with the model, so interpolates it with ' Bilinear Interpolation ' by cv2.INTER_LINEAR.
https://en.wikipedia.org/wiki/Bilinear_interpolation
Bilinear interpolation - Wikipedia
From Wikipedia, the free encyclopedia Method of interpolating functions on a 2D grid Example of bilinear interpolation on the unit square with the z values 0, 1, 1 and 0.5 as indicated. Interpolated values in between represented by color. In mathematics, b
en.wikipedia.org
You can use other interpolation methods if it is proper.
Are you wondering how to recognize multi-digits handwritten ?
next version : https://loookup.tistory.com/12
[DNN] Recognize Multi-Digits Handwritten by MNIST & DNN and Monitor with the Tensorboard
This is the next version of the previous post : https://loookup.tistory.com/11 [Deep Learning] Check Wrong Predictions and Draw number with OpenCV and Predict it by MNIST Data What is ' MNIST ' ? It's a dataset of handwritten, but also makes a lot of newbi
loookup.tistory.com
Thank you for watching !
'Computer Vision > Deep Learning' 카테고리의 다른 글
| [ChatGPT] Apply ' ChatGPT ' to my Code and make my own chatting software (0) | 2023.03.22 |
|---|---|
| [DNN] Recognize Multi-Digits Handwritten by MNIST & DNN and Monitor with the Tensorboard (0) | 2023.03.15 |

댓글